This is the page where I discuss my favourite indicators to use on websites such as tradingview I will be explaining how they work and what benefits they can bring.
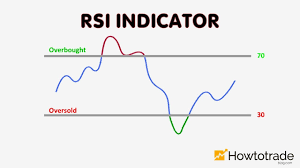
The first indicator I am going to discuss is the relative strength index (RSI) I would recommend using this indicator as it measures the price momentum of a stock or other security. The basic idea behind the RSI is to measure how quickly traders are bidding the price of the security up or down. The RSI plots this result on a scale of 0 to 100. Readings below 30 generally indicate that the stock is oversold, while readings above 70 indicate that it is overbought. Traders will often place this RSI chart below the price chart for the security, so they can compare its recent momentum against its market price.
Support and resistance zone indicator– this is a great indicator that you can introduce to your stock charts when looking out what to trade, the (S&R zone indicator) This indicator allows you to specify price zones in which to detect basic candlestick patterns.In the example above, I have specified the most immediate support and resistance zones on EU/GBP and set the script to detect engulfing candles. If a bearish engulfing candle occurs within the resistance zone a signal will be generated; likewise for bullish engulfing candles within the support zone .
The purpose of this indicator is to generate trading alerts when these patterns occur in order to reduce the screen-time required to monitor setups. This indicator is intended for structure traders primarily, although it could be used by anyone who uses zones and candlestick patterns to enter trades.
If you leave either zone set to 0 then that zone will not be used, meaning that you can use this to detect both support and resistance signals, or only signals at support, or only signals at resistance.
